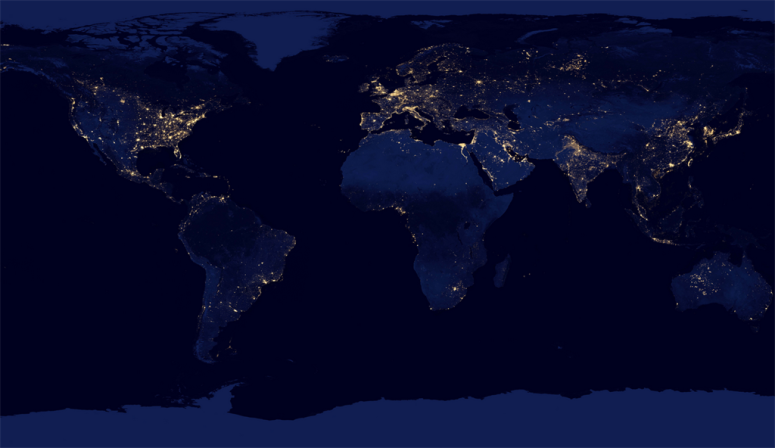
- Below is a satellite composite view of our world at night, illuminated by man-made light.
- Many Oil and Gas (O&G) insinuations can be drawn from this fascinating spectacle:
- We can distinguish immediately where energy demand is highest. The greater the intensity and spread of light, the greater the energy demand.
- Studies show that 56% of global energy is derived from hydrocarbon sources. In our map, these well-lit areas are essentially O&G demand centers. These are the end markets for hydrocarbons, which are often obtained from darker areas on this map.
- Demand location has many consequences for energy policy, transportation, and field development.